


Project Introduction
Background:
As State Grid accelerates the implementation of its strategic goals and deepens its digital transformation and lean management efforts, power supply companies urgently need to overcome bottlenecks hindering work quality and efficiency, such as insufficiently refined management and control, inconsistent implementation standards, and insufficient system data integration. To address these issues, we have decided to introduce technologies such as RPA and OCR to break down system data barriers and build a digital operations monitoring and management system to enhance system standard implementation, marketing risk management, and management value creation.
Purpose:
Reducing the burden on grassroots organizations, improving quality and efficiency;
Adapting to the trend of digital transformation through problem-oriented management and control by "digital employees."
Implementation:
Indicator data: Manual data collection is now replaced by RPA, and displayed on the system.
Internal audits: RPA is used to perform audits based on specified rules (e.g., whether customer electricity prices are correct, whether user settings meet requirements, etc.).
Overdue alerts: RPA is used to perform daily overdue checks on designated processes and links, and alerts (emails) are issued for data that reaches the alert threshold but has not yet been processed.
Alert results display: Data that has been subject to daily alerts but completed within the specified time limit is displayed as an alert result.
Work orders: Based on the power supply station's daily indicator data, audits, alerts, and other data, work orders are automatically generated and emailed to each power supply station. The power company can also manually assign work orders to designated individuals.
Project Overall Design
Achievements
1. Integrate the extensive data analysis, statistics, and reporting tasks performed manually during daily work. Based on the current realities of power supply companies and power stations, the data is comprehensively and systematically summarized and displayed, reducing workload pressure on frontline employees and improving work efficiency.
2. Improve operational efficiency, save time, and free up operational staff.
3. Enhance business accuracy and standardization, monitor, track, and issue alerts on the execution of business processes.
4. Build a scalable and flexible "digital employee" team capable of quickly responding to demanding statistical analysis needs.
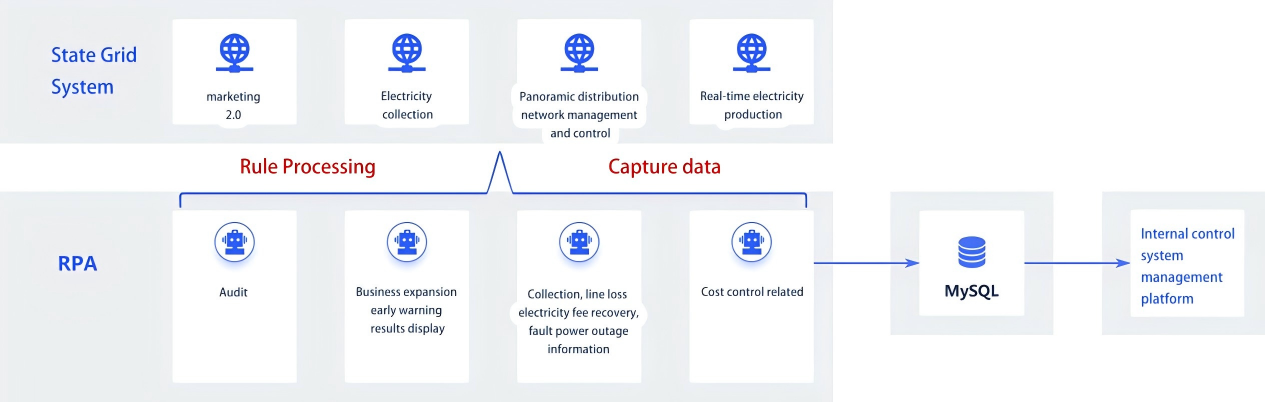
5.Developed over 30 RPA process scripts across four State Grid systems: marketing, electricity consumption collection, distribution network management, and real-time power production. 39 metrics were generated, including: collection rate, line loss, electricity bill recovery rate, and audit failures.
Overall Introduction
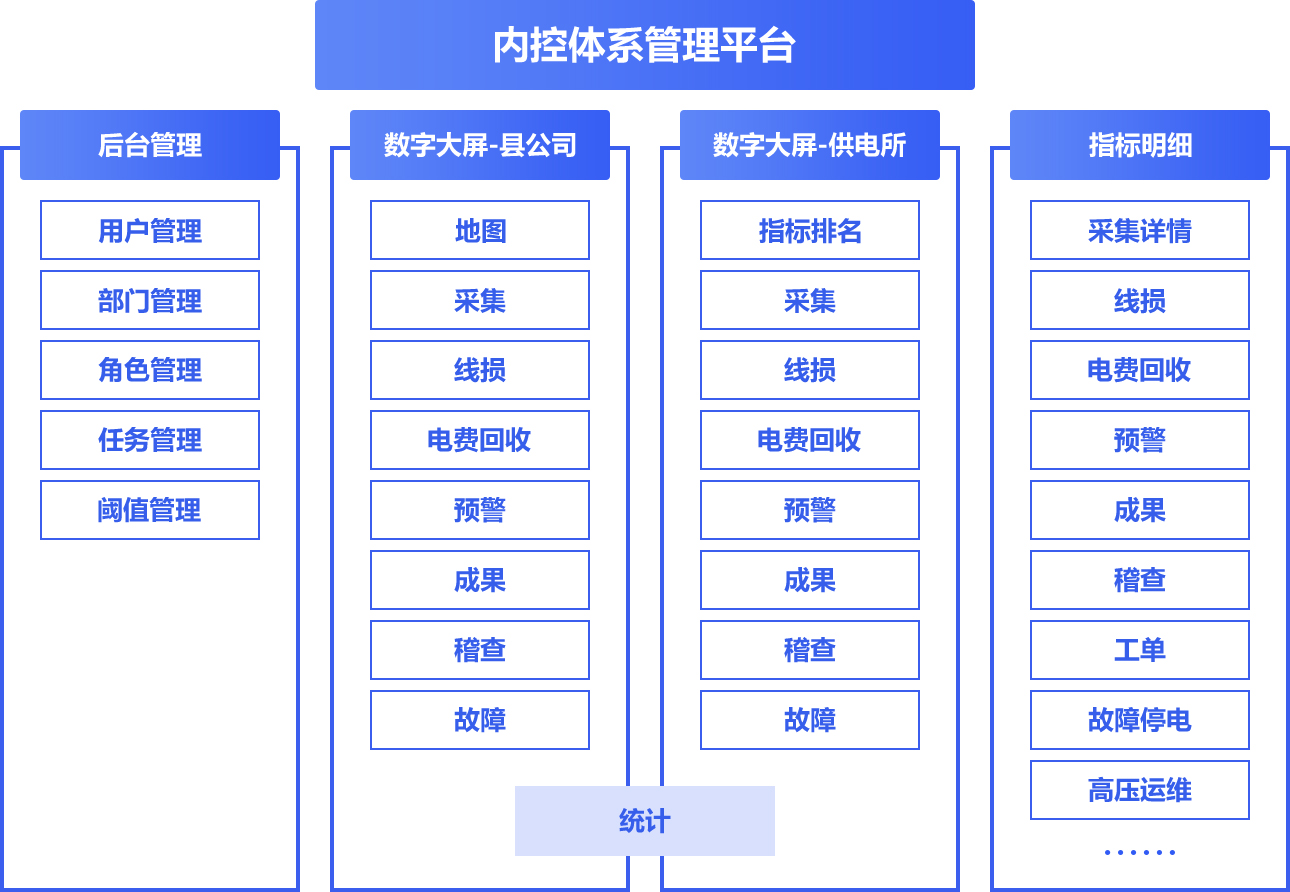
This system is divided into three major modules: the backend is the interface for constructing basic data; the large-screen display interface is divided into the county company interface and the power supply station interface, which displays the summary information of various indicators captured from the State Grid system; the indicator details are responsible for displaying the details of the captured data.
Functionality implemented
The system is divided into three major modules: the backend is the interface for constructing basic data; the large-screen display interface is divided into the county company interface and the power supply station interface, displaying the summary of various indicator data captured from the State Grid system; the indicator details are responsible for displaying the details of the captured data.
-
Backstage Management
Carry out basic data construction and management, including user management, department management, role management, threshold management, task management, etc.
-
Digital large screen display
The digital large screen displays the collected indicators. The county company and power supply station interfaces display different contents, including the county power supply station distribution map, indicator ranking, meter information collection information, area line loss information, electricity fee recovery rate, business process overdue warning, achievement display, independent audit, fault power outage information, and one-click export of morning reports.
-
Operation and inspection information management
View high-voltage operation and maintenance data, and view fault and power outage information
-
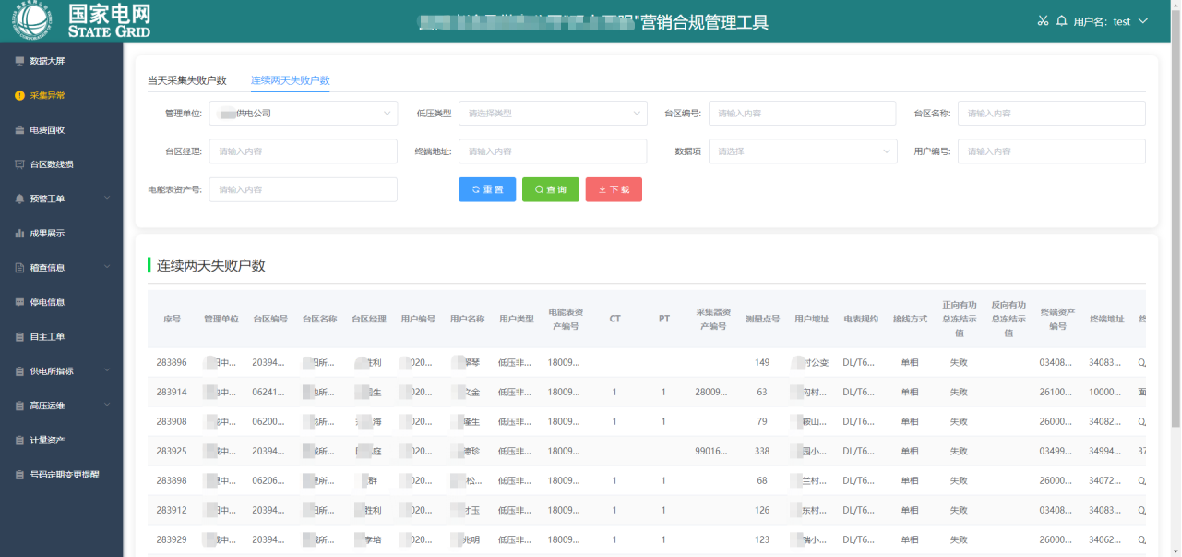
Collection indicator details
Displays detailed information of collection indicators. The data collected by the State Grid system is displayed as is. The indicators include: collection failure details on the day, collection failure details for two consecutive days, line loss failure details on the day, line loss failure details for two consecutive days, and power supply station indicator display.
-
Independent work order management and email sending
1. Manual Work Order: Manually assign a work order to an employee.
2. Automatic Work Order: Based on tasks set by the backend task manager, system data is checked daily and emailed to a designated person.
-
Audit indicator details
Displays audit-related details:
1. Business Expansion Process Overdue Alert: Refer to the backend threshold management configuration for overdue information.
2. Results Display: Data completed within the specified timeframe after the alert is displayed as results.
3. Internal Audit: Displays detailed data for 10 audit items and 20 audit rule violations.+稽查规则不符合的数据明细
Application Scenarios
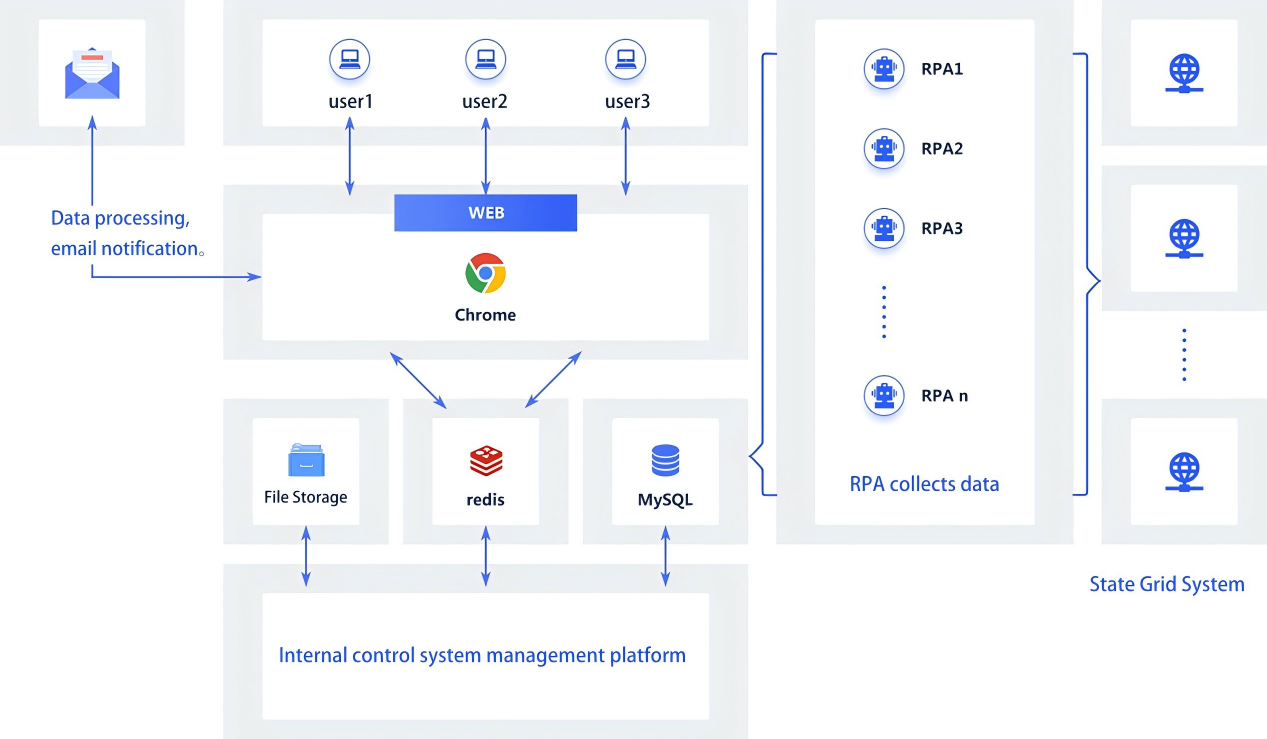
RPA Implementation: Based on customer requirements, this project utilizes four RPA robots to capture various indicator data from the State Grid Marketing 2.0 system, electricity consumption collection system, panoramic distribution network management and control system, and real-time power production system. The data is stored in the database, either as is or after processing. The internal control system management platform then displays the data on the user interface.
Number of Robots: 4
State Grid Systems Involved: 4
Number of Processes: 37
Number of Indicators: 39
Scenario List
Measurement Indicator Process: 8
Auditing Indicator Process: 14
Operational Inspection Indicator Process: 6
Single Script (Not in the Internal Control System): 9
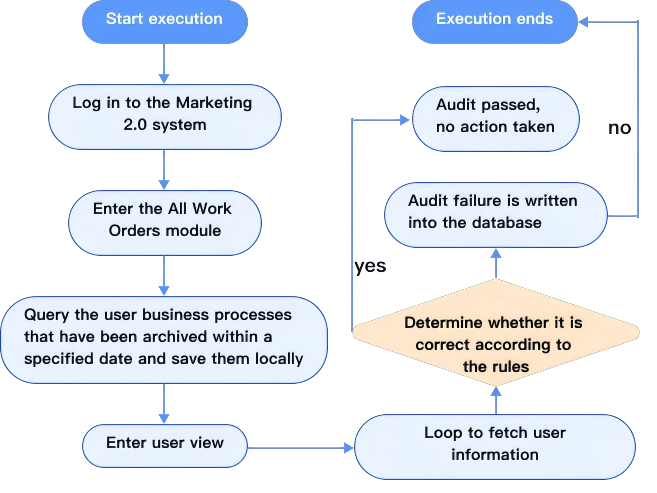
Process Overview 1 - Time-of-Use Electricity Price Audit
Scenario:
Power supply companies may have incorrect customer information due to various reasons, such as changes in customer information or errors entered by sales representatives. However, in practice, sales representatives do not have the time to verify each customer's information individually. Therefore, these errors are typically discovered by the municipal power company, who then issues an audit form to the county power company for rectification.
Scenario Value:
With the introduction of RPA, regular customer audits can be conducted, identifying issues promptly and notifying sales representatives for review and correction, eliminating the need to wait for a unified audit by the municipal power company to uncover any issues.
Display of some audit rules
| Audit topic | Purpose of the test | Execution Strategy |
|---|---|---|
| Abnormal execution of time-of-use electricity price | (1) Abnormal implementation of time-of-use electricity prices: Large industrial and general industrial and commercial electricity users with a capacity of 100 kVA and above should implement but do not implement time-of-use electricity prices (excluding users classified as urban water supply electricity, electrified railway traction electricity, rural radio and television station wireless transmitters (stations), relay stations (stations), differential relay stations (stations), monitoring stations (stations), sewage treatment and recycling, etc., and users with electricity prices of "commercial-retail average electricity prices"). (2) Large industrial and general industrial and commercial electricity users who implement time-of-use electricity prices lack any of the peak, valley, or flat energy display types. (3) Residential users who implement time-of-use electricity prices lack flat or valley display types or have peak display types. (4) Users who implement time-of-use electricity prices have "No" for "Whether to implement peak and valley mark". (5) Users who implement non-time-of-use electricity prices have "Yes" for "Whether to implement peak and valley mark". (6) Users who implement non-time-of-use electricity prices lack the "total active power" display type. (7) The electricity price for general industrial and commercial users with an operating capacity below 100kVA is the "commercial-retail average electricity price" |
Low-voltage non-residential new installation capacity increase Low-voltage residential new installation capacity increase High-voltage new installation capacity increase Suspended restoration Reduced capacity Restored reduced capacity Changed classification |
| Force execution abnormality |
(1) Power regulation execution errors: the power factor of high-voltage industrial users with a contract capacity of 160 (not including 160) kVA or more was not equal to 0.90 or was not implemented; the power factor of ordinary industrial users with a contract capacity of 100 kVA or more and non-industrial (including agricultural irrigation and drainage) users with a contract capacity of 100 kVA or more was not equal to 0.85 or was not implemented; for agricultural production users, the power factor was not equal to 0.80 or was not implemented. (2023-06-06, contract capacity was changed to operating capacity) (2) The "total reactive power" display type was missing in the electric energy display information of users subject to power rate assessment. (3) Two power regulation standards were implemented for the same user. |
Low-voltage non-residential new installation capacity increase High-voltage new installation capacity increase Suspended restoration Reduced capacity Restored reduced capacity Changed classification |
| The number of split tables is abnormal | The reading of the meter is less than the reading of the previous period or the reading difference is greater than 2000. | Measuring equipment troubleshooting |
| Abnormal implementation of electricity prices for residential charging piles | Users who are charged residential electricity rates and classified as "charging and swapping service industry" are not using the combined meter residential time-sharing system (electricity used by electric vehicle charging and swapping facilities). PS: Users whose industry classification is "charging and swapping service industry" or whose charging pile user indicator is "yes" |
Low-voltage non-residential new installation capacity increase Low-voltage residential new installation capacity increase Renovation |
| 。。。 | 。。。。。。 |
value
Reduces error rates and risks
Interface display
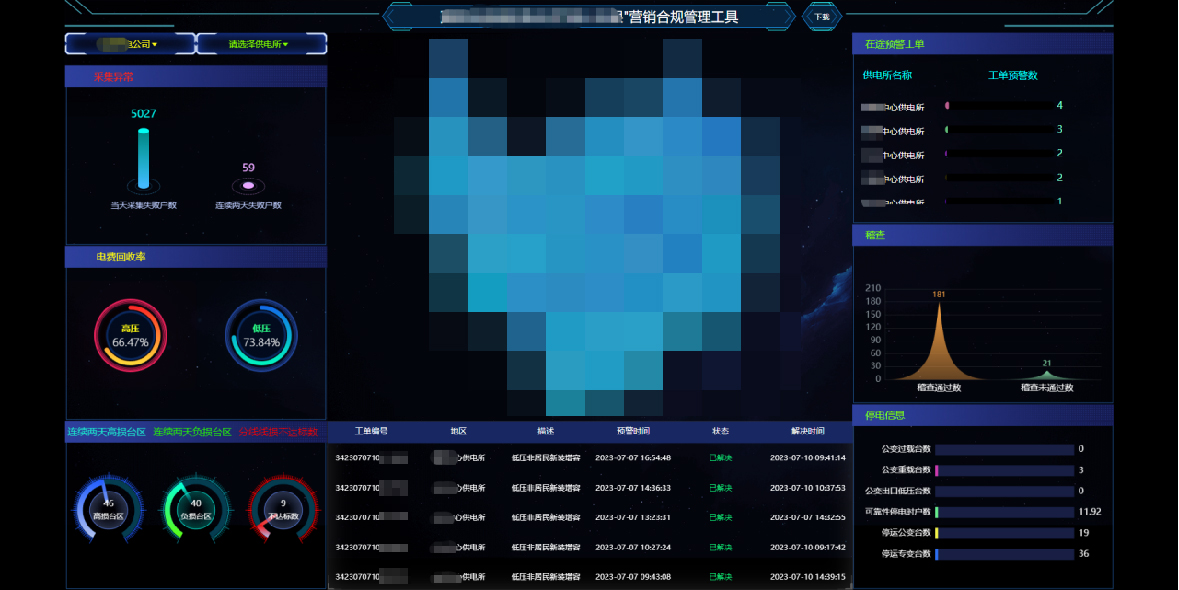
County company-large screen
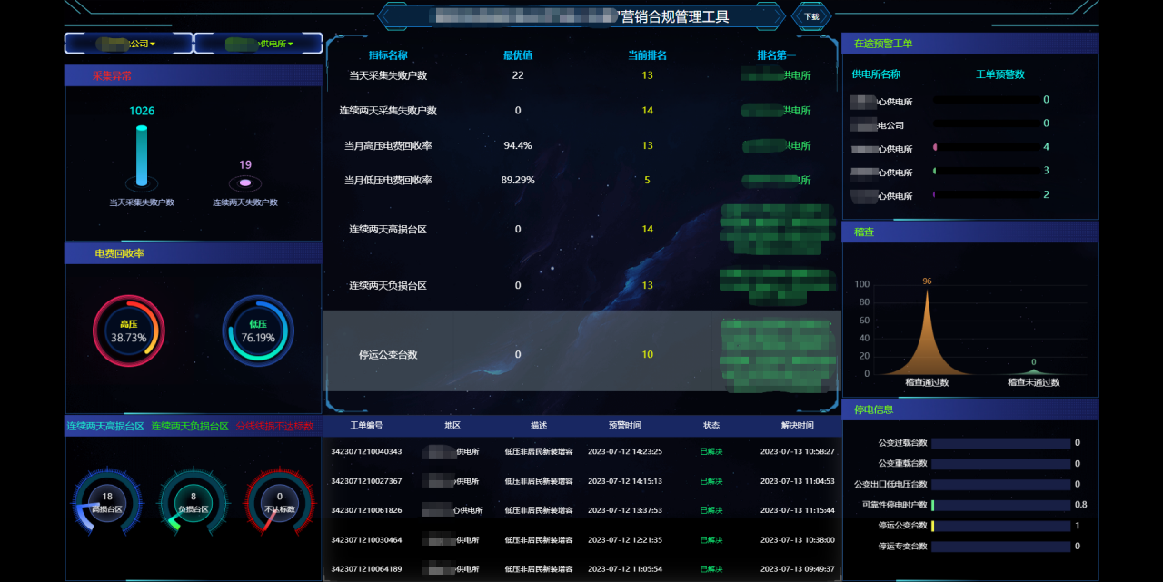
供电所-large screen
采集详情
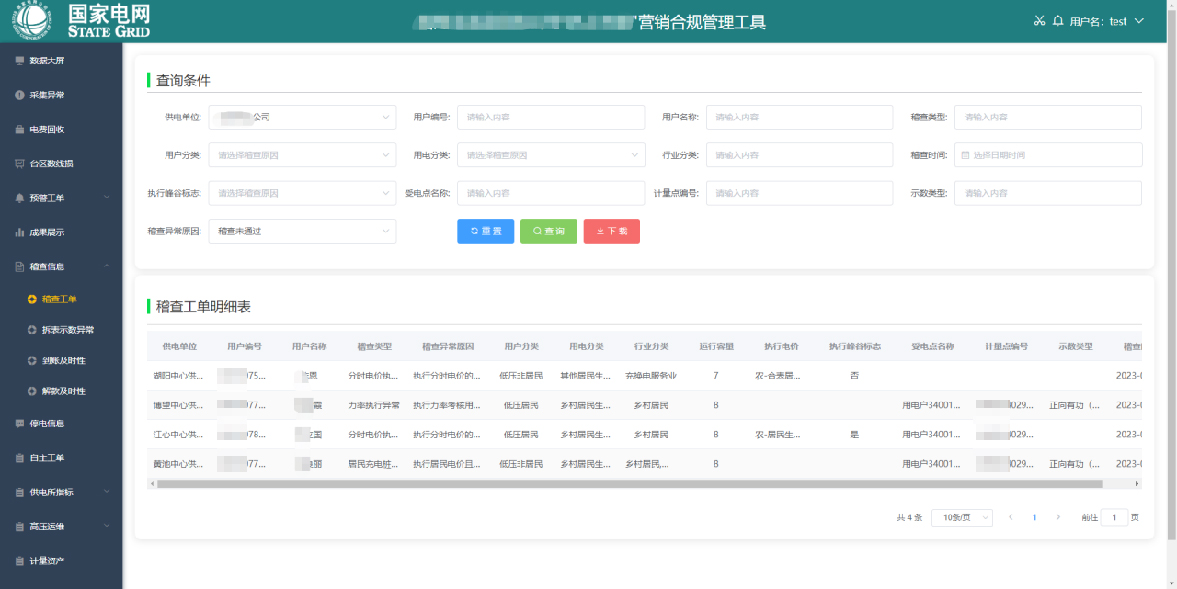
内部稽查
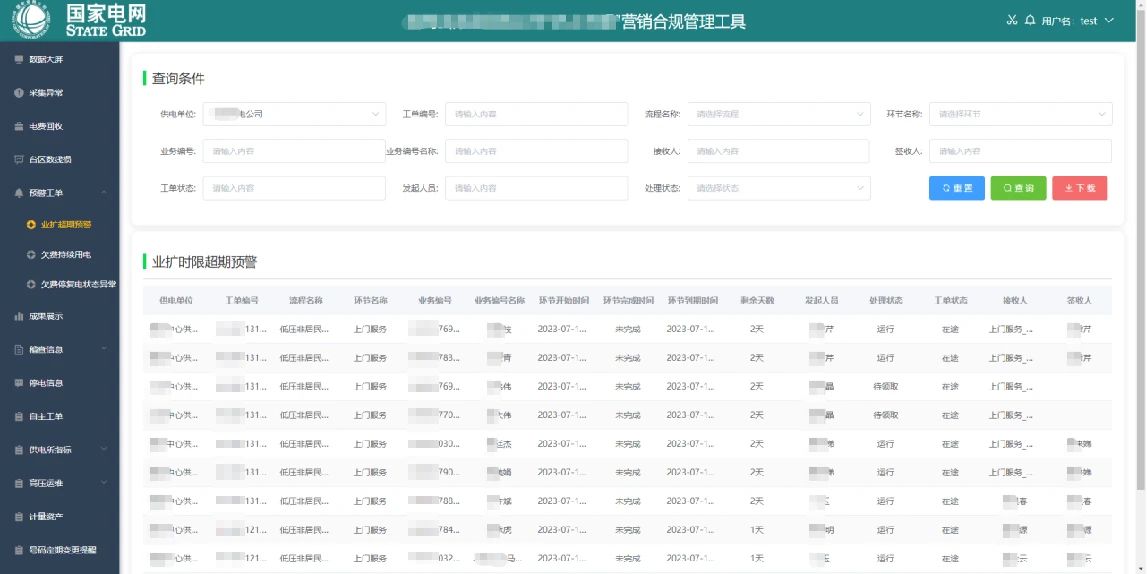
超期预警
